Welcome a powerful analytics platform Adjust
What does Adjust do?
Adjust analyzes all your data in one place, collects information on how long users visit your website, and what they want to purchase, records what ads you tend to click on, user’s IP address, and which device you use for making a purchase.
Strengths:
- Accurate custom reports;
- Simple cohort dashboard;
- Optimizes your campaigns for maximum efficiency;
- Customizes the interface to fit your needs.
Getting started with Adjust
The Adjust dashboard is a place where you can measure campaigns, manage app settings, evaluate user performance, and track in-app events.
After you log in to Adjust and accept The Terms and Conditions, you are offered to create your first app.
You can add mobile and connected TV apps to the Adjust dashboard.
- Choose New App.
- Enter your App ID (mobile apps only).
- If you haven’t submitted your app to an app store yet, click on I don’t have an app ID yet.
- Enter an App Name.
- Choose your platform ( Android, iOS, Windows Phone Windows).
- If your app is multiplatform, follow these steps after you’ve added the app to the Adjust dashboard.
- If you chose Android, choose one store. If you chose iOS, enter your bundle ID.
- Choose your Reporting Currency.
- Choose to Create App.
- Enter your in-app event names and choose Add Events (or you can add them later).
- Optional: enter your developer’s email address(es) to send our SDK implementation guides.
- Choose Done. Great! Your app setup is finished.
Now we are about to set up a multi-platform app
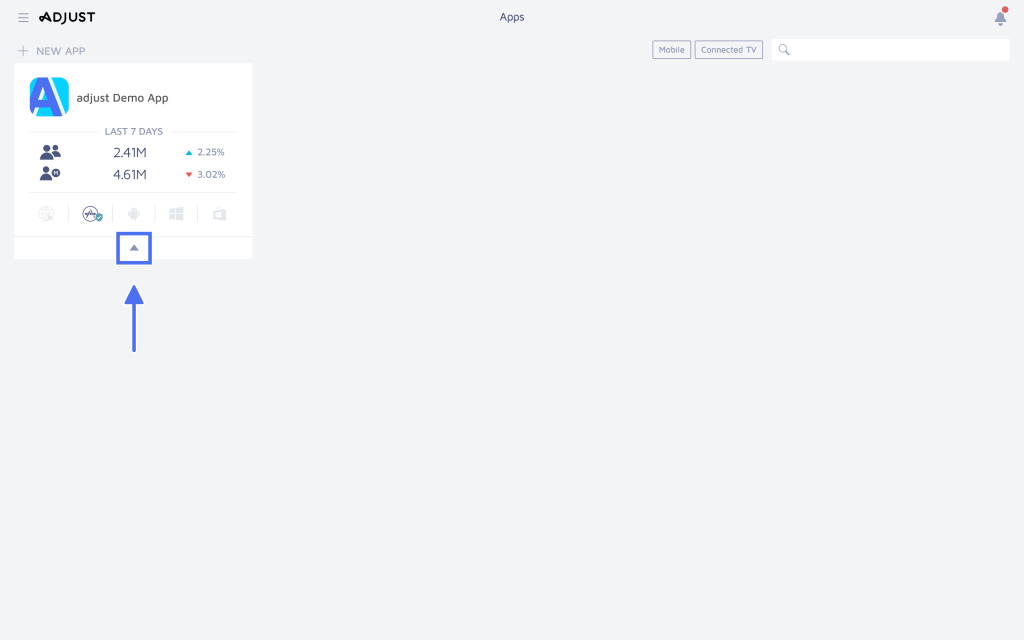
- Find your app and select your app options caret (^).
- Choose All Settings, then Platforms.
- Slide the Multi-platform App and switch to ON.
- Choose the missing platform.
- Enter the required platform-specific details.
- Optional: for redirecting users to a third-party store/alternative landing page, put the URL in the CUSTOM URL field.
- Optional: for setting a default platform, click the platform icon and choose SET AS DEFAULT PLATFORM. This is where Adjust will redirect users if we don’t recognize the device OS and there’s no fallback URL.
- Click on SAVE.
Cool! Your multi-platform app setup is complete.
App statistics will display data from all platforms under your multi-platform app. To separate platform data, use the Platforms filter (Filters > View by > Platforms).
Statistics
With Statistics, you can check KPIs, ad spend, ROI, and the whole picture of what is going on with your campaigns.
To view your Statistics, you need to:
- Account-level Statistics: Select MENU to open the main menu, then select Statistics
App-level Statistics: Find your app and select your app options caret (^), then select Statistics OR find your app and select the app icon
Your statistics table contains 4 paragraphs:
- Deliverables
- Fraud Prevention
- Ad Spend
- Cohorts
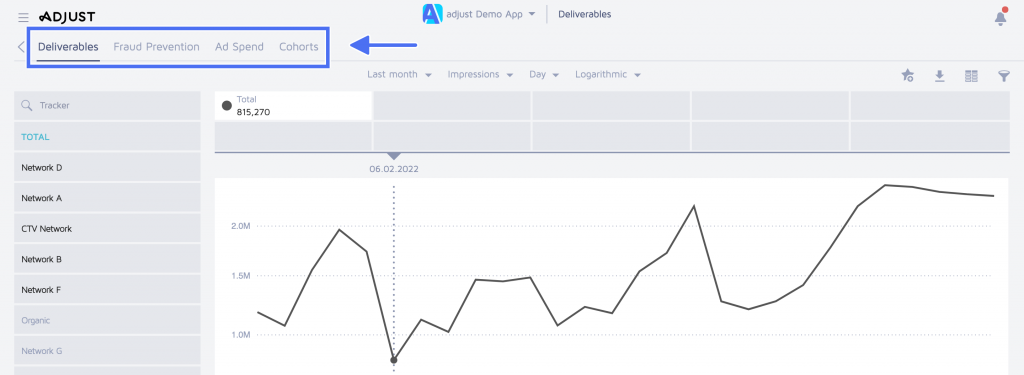
Deliverables tab shows your campaign data and app activity. The columns of the chart are your key performance indicators (KPIs). These are attribution details (like clicks and installs) or app events. You may see any timeframe as you like, just select the wanted period.
Fraud Prevention contains all of your analytics from the suite, including your untrusted devices, rejected reattributions, and other suspicious operations.
Ad Spend contains information on how much you spend on your ads from source to source. Every column reveals a cost KPI, and every row demonstrates ad spend data per network. Cohorts tab is a great tool that shows you a user’s behavior: where users drop off and/or churn.
How to understand icons

star icon – means Create View
arrow icon – means Download CSV
graph/chart icon – means Switch views
funnel icon – means Filter