How to work with the premium Applovin gambling application? Our case with opinions and life hacks!

Recent studies estimate that the average cost of app development can range from $50,000 to over $200,000. But with over two million apps to choose from in the Apple App Store and Google Play Store, creating an app doesn’t mean users will automatically flock to it, and it’s increasingly difficult to retain the users you do get.
To recoup development costs and gain long-term benefits from an app, companies need more than just ASO (App Store Optimization) and push notifications. This is where application advertising comes to the rescue, which is what we want to dedicate today’s article to!
Let’s start, as usual, with an introductory introduction about our client, or rather about the product! In this case, it is a gambling application for Android. The mechanism of the application is that the user spins slots and gets the opportunity to win real money. The main thing that the client wanted to receive was a post-instal event, and it is important that for each event the client was ready to pay a certain price for each geo. Geo was chosen by the client himself and gave us a list with expected prices for the installation:
With a budget of $1000 daily, unscrew 6 geos to start with CA NO DK CH NZ PL, with the main optimization goal (first step): CA NO DK CH is $130 ($130 CPA fee). NZ – 100$; PL – 50$
To work with the Applovin platform (an article about this platform is here), the client needed to provide a suppression list. This is a pure device ID GAID (Google Advertising ID) file to be shared with us, to block all existing users who have the app from seeing our campaign. Applovin requested a funnel (customer path from advertising to installation) and postbacks from Appsflyer.
The funnel should look like this:
– showing our ads in publisher apps
– click on our advertisement
– go to Google Play
– application download
– application installation
– registration
– purchase (deposit)
– re-purchase (re-deposit)
There were also advertising creatives on the client side, we, in turn, selected a convenient and effective platform for promotion and carried out optimization.
Also, what is the conversion rate from Install to Deposit (or the CPA event)
– By last month’s conversion rate:
CA:
mint (i2r – 13%, r2d – 3%)
google (i2r – 7%, r2d – 2%)
NO:
mint (i2r – 9%, r2d – 2%)
DC:
mint (i2r – 16%, r2d – 11%)
CH:
mint (i2r – 14%, r2d – 6%)
PL:
mint (i2r – 22%, r2d – 11%)
google (i2r – 15%, r2d – 6%)
N.Z.:
mint (i2r – 19%, r2d – 10%)
Finally, let’s move on to numbers and statistics in general. We would like to compare the first month of operation (August 2023) and the second (September 2023).
During the first month of the advertising campaign (all of August 2023), the geo campaigns expanded greatly, and RO DK AU PT AT HU FI LU were added.
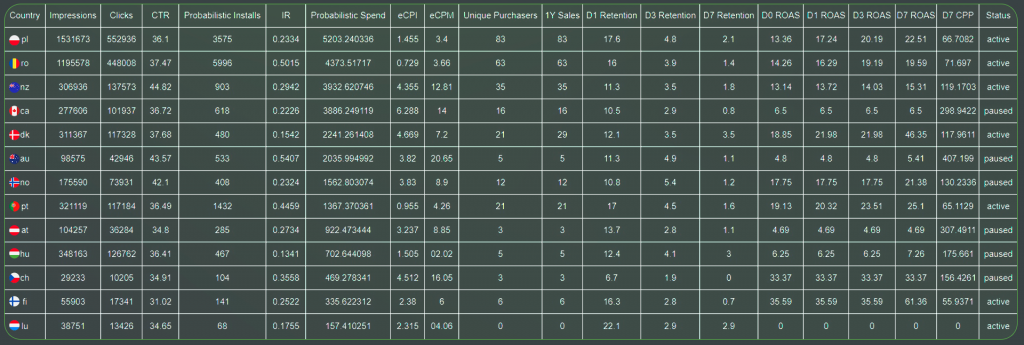
By analyzing these statistics from the dashboard, we can be sure that this was a User Acquisition advertising company optimized for CPP (Cost per purchase) or in other words CPA. We also tried the IAP ROAS format in September 2023, but it was absolutely not suitable for the application. Since the expenses were high compared to the number of conversions (deposits) received. The client received advertising results that completely satisfied him.
Spending for August 2023 by CPA campaign for all geos was $27,190.49
Number of installed installs received – 15,010
CPI – $1.81
CPM – $5.67
Number of conversions – 281 (deposits)
The CPA (deposit) was even less than the client expected – $105.39.
Now let’s compare it with the second month of work, September, where we optimized advertising, reduced CPA and maintained the client’s budget.
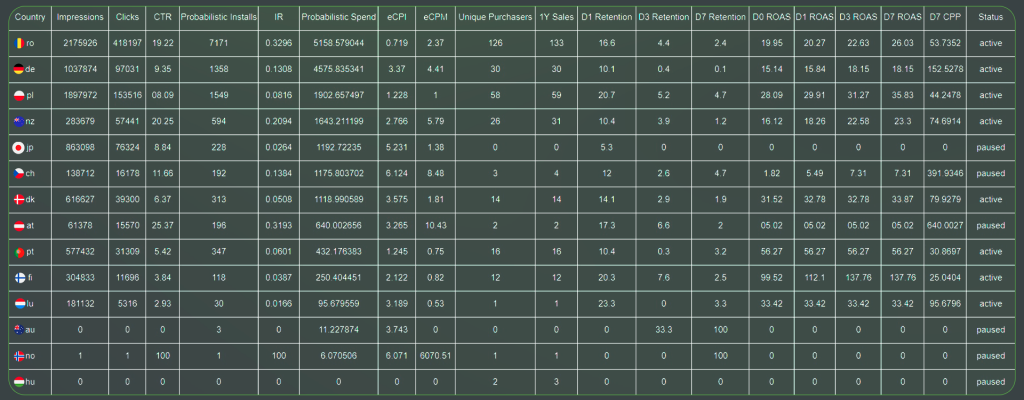
Spending for September 2023 for the CPP campaign for all geos was $18,203.36. Added 2 more new geos: JP, NO
Number of installed installs received – 12,100
CPI – $1.50
CPM – $2.24
Number of conversions – 306 (deposits)
The CPA (deposit) was even less than the client expected – $77.79.
Comparison by month The first month was testing, in the second month geos were added and everything was improved and optimized, CPA (deposit) decreased by 31.57% in September.
As we can see from the numbers, the campaign was able to be properly optimized and the number of conversions increased, expenses fell (with an increase in geo by +2), and the cost of conversion dropped significantly. Based on work experience, the first month at Applovin is always a period of optimization, algorithms and inventory are adjusted to the desired goals and objectives, the grid selects source lists. Accordingly, we continue to work with the client, which makes him happy and satisfied with the success of the advertising.
While working with the platform and this case, we saw some disadvantages. The downsides were that very often traffic to geos from the client’s list simply stopped, and there were no expenses or conversions. But then the client asked that the network raise the bid and budget specifically for the desired geo and the traffic either started flowing again, or a little time passed and everything came back.
Conclusion.
The client’s budget for all these geo and CPA campaigns has now grown to $3k per day, the client is satisfied with the traffic and therefore is ready to spend more for the results. Considering the fact that advertising is optimized with each month of work!
Applovin has quite expensive traffic, but nevertheless it is of high quality. They have a good gambling inventory and can achieve their goals and the required number of deposits. The only difficulty is that the Applovin platform monitors its reputation and it is difficult to get to them. The application must have at least 100k organic installs, and this is quite difficult, the application must live for a long time and have a good reputation (positive reviews). Only by implementing this marketing system will you be able to successfully work with Applovin and get good, high-quality results, and we will help you with this!