7 Google Analytics reports that you misuse

Google Analytics is a wonderful tool with which any marketer can optimize your content, website and advertising campaign. However, there are still pitfalls in the work with cheapest Analytics tool on the Internet. So, below we will discuss 7 of the most common reports, GA, which you most likely do not work correctly.
Google Analytics is a wonderful tool with which any marketer can optimize your content, website and advertising campaign. However, there are still pitfalls in the work with cheapest Analytics tool on the Internet. So, below we will discuss 7 of the most common reports in GA that you are most likely working incorrectly.
The speed of the website
Website speed is one of the most important indicators to optimize User Experience (user experience). However, most Internet marketers there is no clear understanding about the speed of my website because of how it will be measured.
By default, GA measures the speed of the website through the sample loading time to 1% of your visitors. It’s a really small sample size, which increases the chances of providing incorrect data. Fortunately, this can be corrected.
You can add in Google Analytics code, which will increase the sample to 100%. To do this, go into Admin> tracking Code, and then directly into the tracking code. Here you will see code like this:
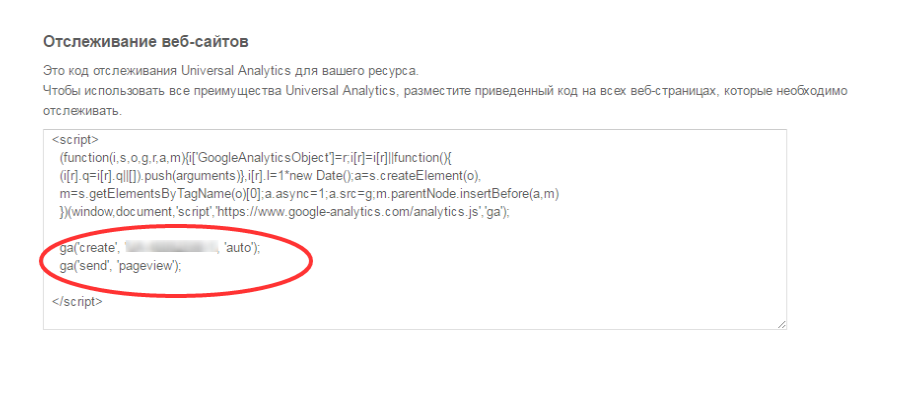
Change the script to this:
ga(‘create’, ‘[YOUR GA ID]‘,{‘siteSpeedSampleRate’: 100});
Save the changes and get accurate data.Some indicators, such as speed of the website is designed for sites with high traffic levels. In order to avoid too small sample of your visitors, it is important to adjust these figures to adjust the settings to suit your needs.
Bounce rate
Most marketers think that a high bounce rate is really bad. This means that visitors who came to the site, found what I was looking for and left. But really, it’s not always the case.
Have you had that you were interested in the blog post, quickly found what I was looking for and closed the page? I have this happening several times a day.
As a second example, a page of contacts. The purpose of your visit is to find the address of the company. On the contacts page, you immediately see where to go, and quickly closed it. And in fact, with interaction on the site is all right, but Analytics will still regard such behavior as failure.
After reading your post, a user left the page, perhaps in order to “make friends” with you on social networks, or gone to later to become your regular customer. Despite the fact that a high bounce rate indicates that site-something is wrong, there is a certain percentage of cases, when such a figure is acceptable.
So instead of having to worry about the high failure on each page, it is better to pay attention to the content and how visitors react to it.
Indicator outputs
As well as the story with the bounce rate, the high rate of exits is forcing marketers to think only in a negative way, while it is not always the case. Recall that the rate of exits is the percentage of traffic that stops to interact with your site on this page. Unlike the bounce rate, in this share get visitors who viewed several pages on the website.
For example, a page with content designed to convert visitors, and doing it effectively, will have a high rate of exits. In the same page, located high in the results for low-frequency queries is likely to be the percentage of outputs higher than on other pages. And it does not mean that the page is not carrying a value for the visitor.yayayayaya
That is why it is important to understand the significance of each page and its search position before horrified high rates.
Conversion rates by channels
Google Analytics calculates conversion rate based on the last non-direct click pre-commit conversion. This is the best way to determine what exactly contributed to the conversion. But sometimes users come back as direct traffic that is often not taken into account. That is why the actual conversion rate across channels is underestimated.
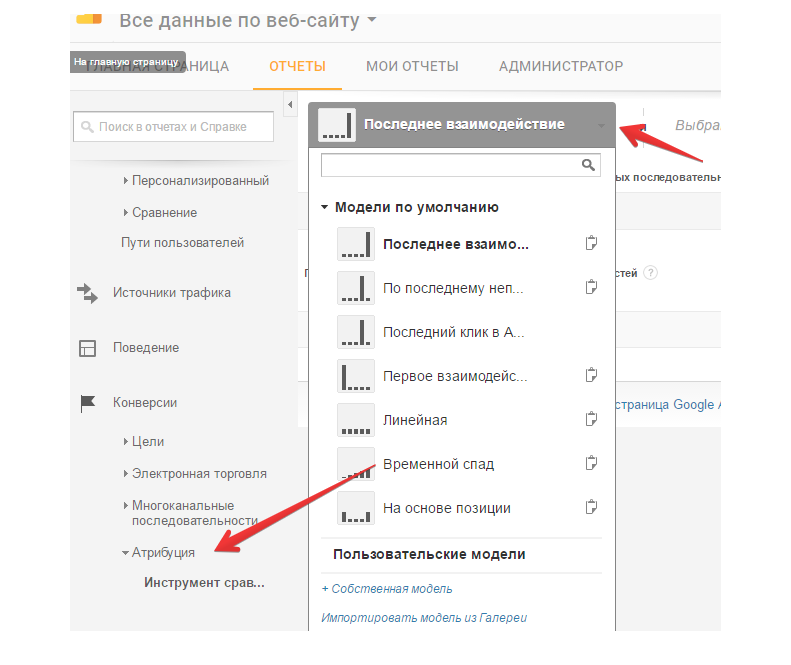
Alleivate multi-channel funnel reports and attribution modeling, in addition to the conversion rate per channel and you will get a much more clear picture.
Find the model comparison tool, which will help to understand how different attribution models impact the valuation of your marketing channels, under Conversions>Attribution>the model comparison Tool:
The average duration of a page view
Many marketers assume with confidence that the average duration of page view means how much time visitors are spending time on the consumption of content. But Google Analytics this metric gives a slightly different meaning.
The average duration of the page view shows how long your web page has been opened in the user’s browser. However, GA will not be able to give you accurate data on the viewing page if the user opened multiple tabs simultaneously and it switches between them from time to time, browsing other site until the tab with your page open.
Once the user is within 30 minutes was reviewing your page Analytics will go into standby mode. But you must admit that when the user browsed for a minute a few pages of your site, and then leaving the tab open, went somewhere the other resource is not entirely accurate tracking information. In addition, GA can’t provide data about how much time the user spent viewing the last page because viewing the following pages are not followed.
At the moment there is little you can do to improve the accuracy of this indicator so just keep in mind that it will almost always be overvalued relative to the real behavior.
Professional course on web Analytics
New and returning visitors
New vs. returning visitors – is also very confusing marketers indicator. This is because the GA keeps track of returning visitors by using cookies. So any returning to your site visitor who deleted your browser history, will be considered a new visitor. In addition, users coming to your website from different devices (be it mobile, tablet or just a different laptop), also will be treated as new visitors.
Many regard a low percentage of return users as a bad sign and a signal of a poor user retention on the site. It may be a fair statement, but it is important to remember that a large number of these new visitors is not so new. It is also possible that your site is so good targetirovanie that buyers from buying your items on your first visit and do not come back. That, on the one hand, and not bad. Here it is before the marketer needs to be a question of quality retargeting and work on return visitors.
Yeah, at this rate it is important to note, especially if it has changed dramatically, but don’t let it be the only driving force for changes in your content strategy.
Keep in mind that among your new and returning visitors there are many so-called “noise”.
Referral traffic
Many marketers believe that referral traffic pokazyvat the number of backlinks on the website. But this indicator there are many nuances.
Transitions from social networks or from your mailings can also be taken by Analytics for referral traffic. And even the transitions from page to page on your site. But you can fix it.
For social media. Use tools to shorten links such as bit.ly add the tracking code to your links to understand where they came from.
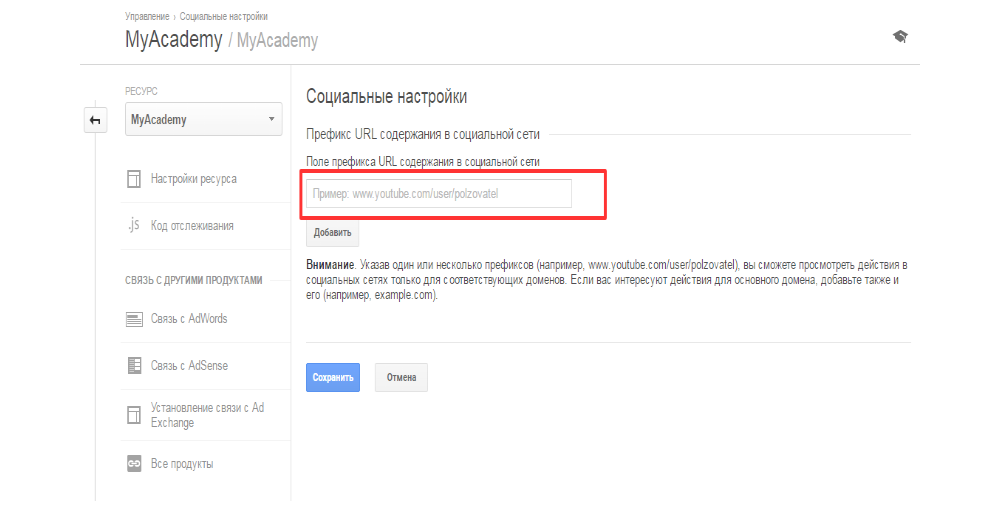
Then in the Admin tab go to Social settings, add the desired URL. Now GA will know that it is not referral traffic.
Email marketing. Use the URL Builder, with which you can add to the URL the parameters needed to monitor ad campaigns via e-mail.
Your website. Make sure all links on your site linking to relative URL (/page), not the full URL. Full address will be counted in referral traffic in GA, while the relative will not be considered.
Do your best to clean from the noise of referral traffic, but do not forget that you will not be able to completely clear the statistics.
And finally…
Google Analytics is a very valuable marketing tool, but it is important to take all data at face value. Here are some key things to keep in mind when analyzing your metrics:
The high percentage of failures and outputs is not always a bad thing.
The speed of the website and referral traffic have a number of limitations that you can easily fix.
Conversion rates through the channels, the Average duration of page views, New vs. returning visitors – have limitations, which are still can be circumvented.
The best thing you can do to improve the understanding of your Analytics to assess the whole picture, studying each figure, and remembering about their limitations. Focus on how the data reflect actual user behavior.
The only way to understand what the data do indicate something good or bad – to make sure that your website match the configured goals in your Google Analytics account.